[root@master-01 addons]# kubectl create namespace missing-container-metrics namespace/missing-container-metrics created [root@master-01 addons]# helm install missing-container-metrics missing-container-metrics -n missing-container-metrics NAME: missing-container-metrics LAST DEPLOYED: Tue Jul 6 10:47:35 2021 NAMESPACE: missing-container-metrics STATUS: deployed REVISION: 1 TEST SUITE: None [root@master-01 addons]# helm -n missing-container-metrics list NAME NAMESPACE REVISION UPDATED STATUS CHART APP VERSION missing-container-metrics missing-container-metrics 1 2021-07-06 10:47:35.261058822 +0800 CST deployed missing-container-metrics-0.1.1 0.21.0 ##因为我只有一个节点,所以这里daemonset 就只有一个pod [root@master-01 addons]# kubectl get pod -n missing-container-metrics NAME READY STATUS RESTARTS AGE missing-container-metrics-s9cgk 1/1 Running 0 115s
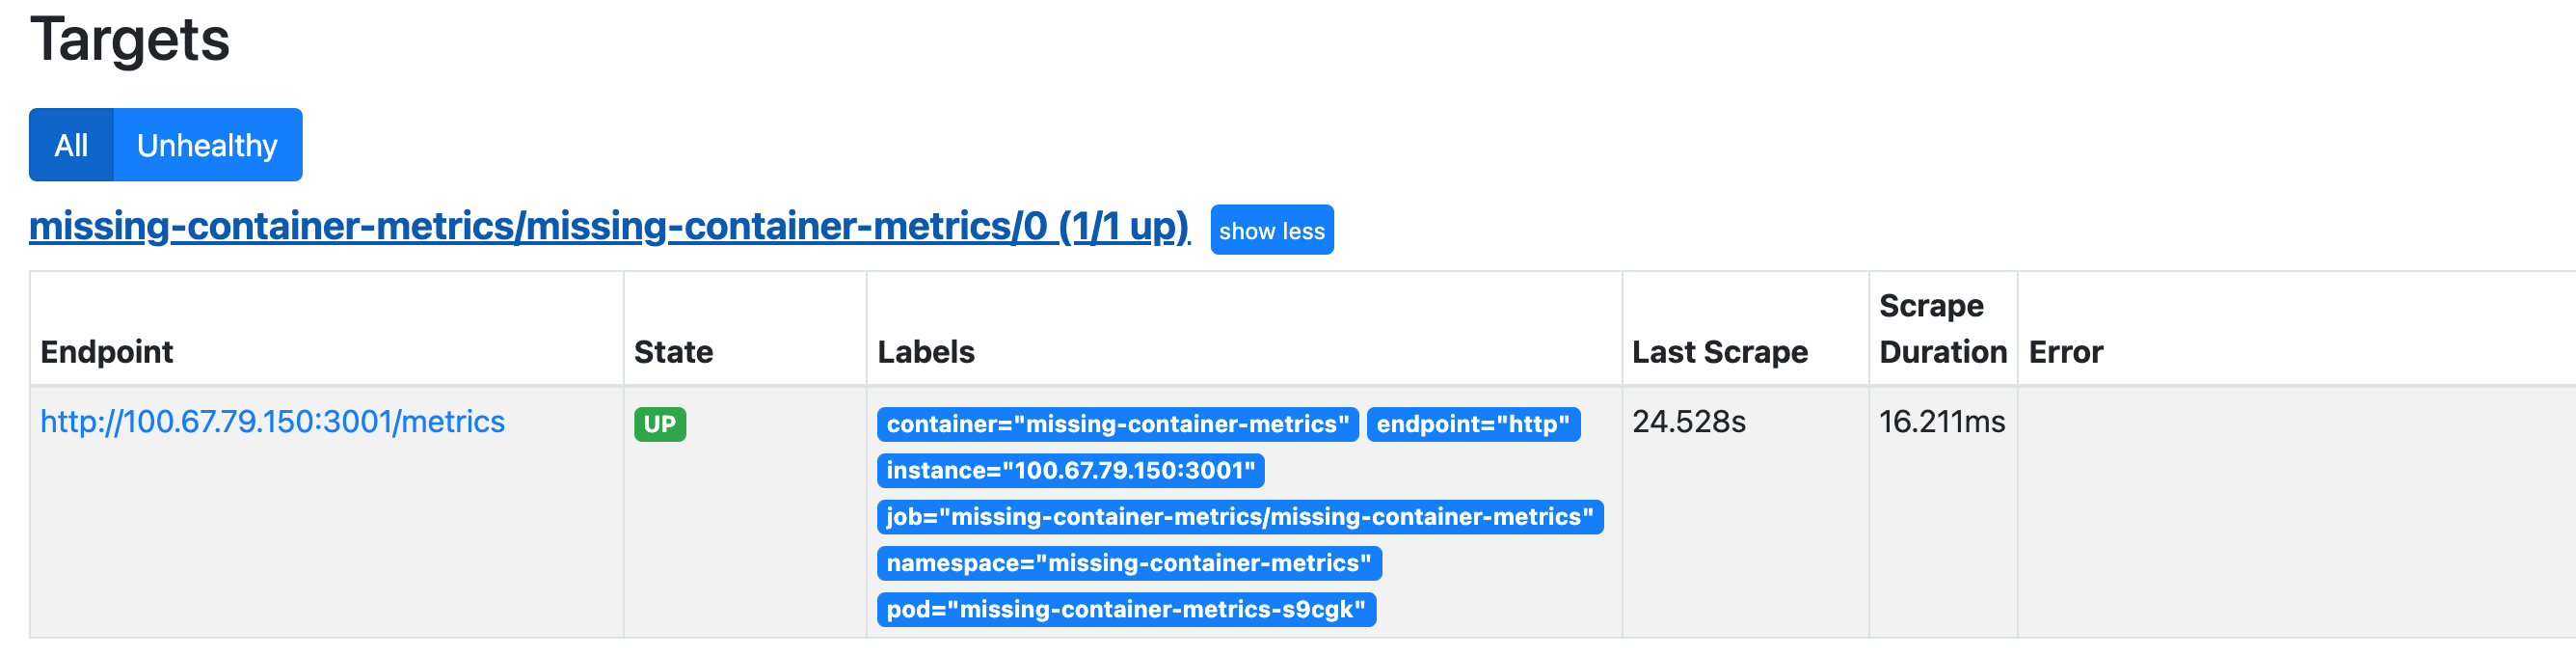
我们可以访问服务的3001端口查看metrics,例如
1 2 3 4 5 6 7 8
[root@master-01 addons]# curl 100.67.79.150:3001/metrics # HELP container_last_exit_code Last exit code of the container # TYPE container_last_exit_code gauge container_last_exit_code{container_id="docker://0133fb5d739ba98b3985bdc7766fa200334bbbf29de9a61f98a463ec00de53de",container_short_id="0133fb5d739b",docker_container_id="0133fb5d739ba98b3985bdc7766fa200334bbbf29de9a61f98a463ec00de53de",image_id="docker-pullable://k8s.gcr.io/pause:3.2",name="k8s_POD_dns-autoscaler-565bf94d6c-dc6v4_kube-system_96437fe8-200c-4845-a7cc-a27790c6c5a7_0",namespace="kube-system",pod="dns-autoscaler-565bf94d6c-dc6v4"} 0 container_last_exit_code{container_id="docker://0388ba15b0181fead17cfc3606a57aeef0a9b8b73cf3f97eb901565c8aa1702c",container_short_id="0388ba15b018",docker_container_id="0388ba15b0181fead17cfc3606a57aeef0a9b8b73cf3f97eb901565c8aa1702c",image_id="docker-pullable://sha256:e20d2ec0d0ed8ffd693b435af9f2943095a608440e3b845331d6d00344025455",name="k8s_victoriametrics_victoriametrics-0_kube-system_7b381d2c-791b-4e38-8cbb-43485afcb285_0",namespace="kube-system",pod="victoriametrics-0"} 0 container_last_exit_code{container_id="docker://0400f7e29dab47304f97669cb52b5c7c9310fbb5c156c07d0dc9bfca6b8ee14d",container_short_id="0400f7e29dab",docker_container_id="0400f7e29dab47304f97669cb52b5c7c9310fbb5c156c07d0dc9bfca6b8ee14d",image_id="docker-pullable://k8s.gcr.io/pause:3.2",name="k8s_POD_csi-resizer-f6d66495f-s4vkv_longhorn-system_282278da-2638-4e26-8411-802bf57c1ed8_0",namespace="longhorn-system",pod="csi-resizer-f6d66495f-s4vkv"} 0 container_last_exit_code{container_id="docker://04e2c60777ce277c62c7137f1d7b40d9c1523bb3edf9127efd357590f39ba79c",container_short_id="04e2c60777ce",docker_container_id="04e2c60777ce277c62c7137f1d7b40d9c1523bb3edf9127efd357590f39ba79c",image_id="docker-pullable://k8s.gcr.io/pause:3.2",name="k8s_POD_kube-state-metrics-859b6bf99-q8tdf_monitoring_529aa188-f7a0-4b5c-9608-cd8fc473ac8c_2",namespace="monitoring",pod="kube-state-metrics-859b6bf99-q8tdf"} 0
useDocker:true useContainerd:false ###添加 prometheusOperator: podMonitor: # Create a Prometheus Operator PodMonitor resource enabled:true # Namespace defaults to the Release namespace but can be overridden namespace:"" # Additional labels to add to the PodMonitor so it matches the Operator's podMonitorSelector selector: app.kubernetes.io/name:missing-container-metrics
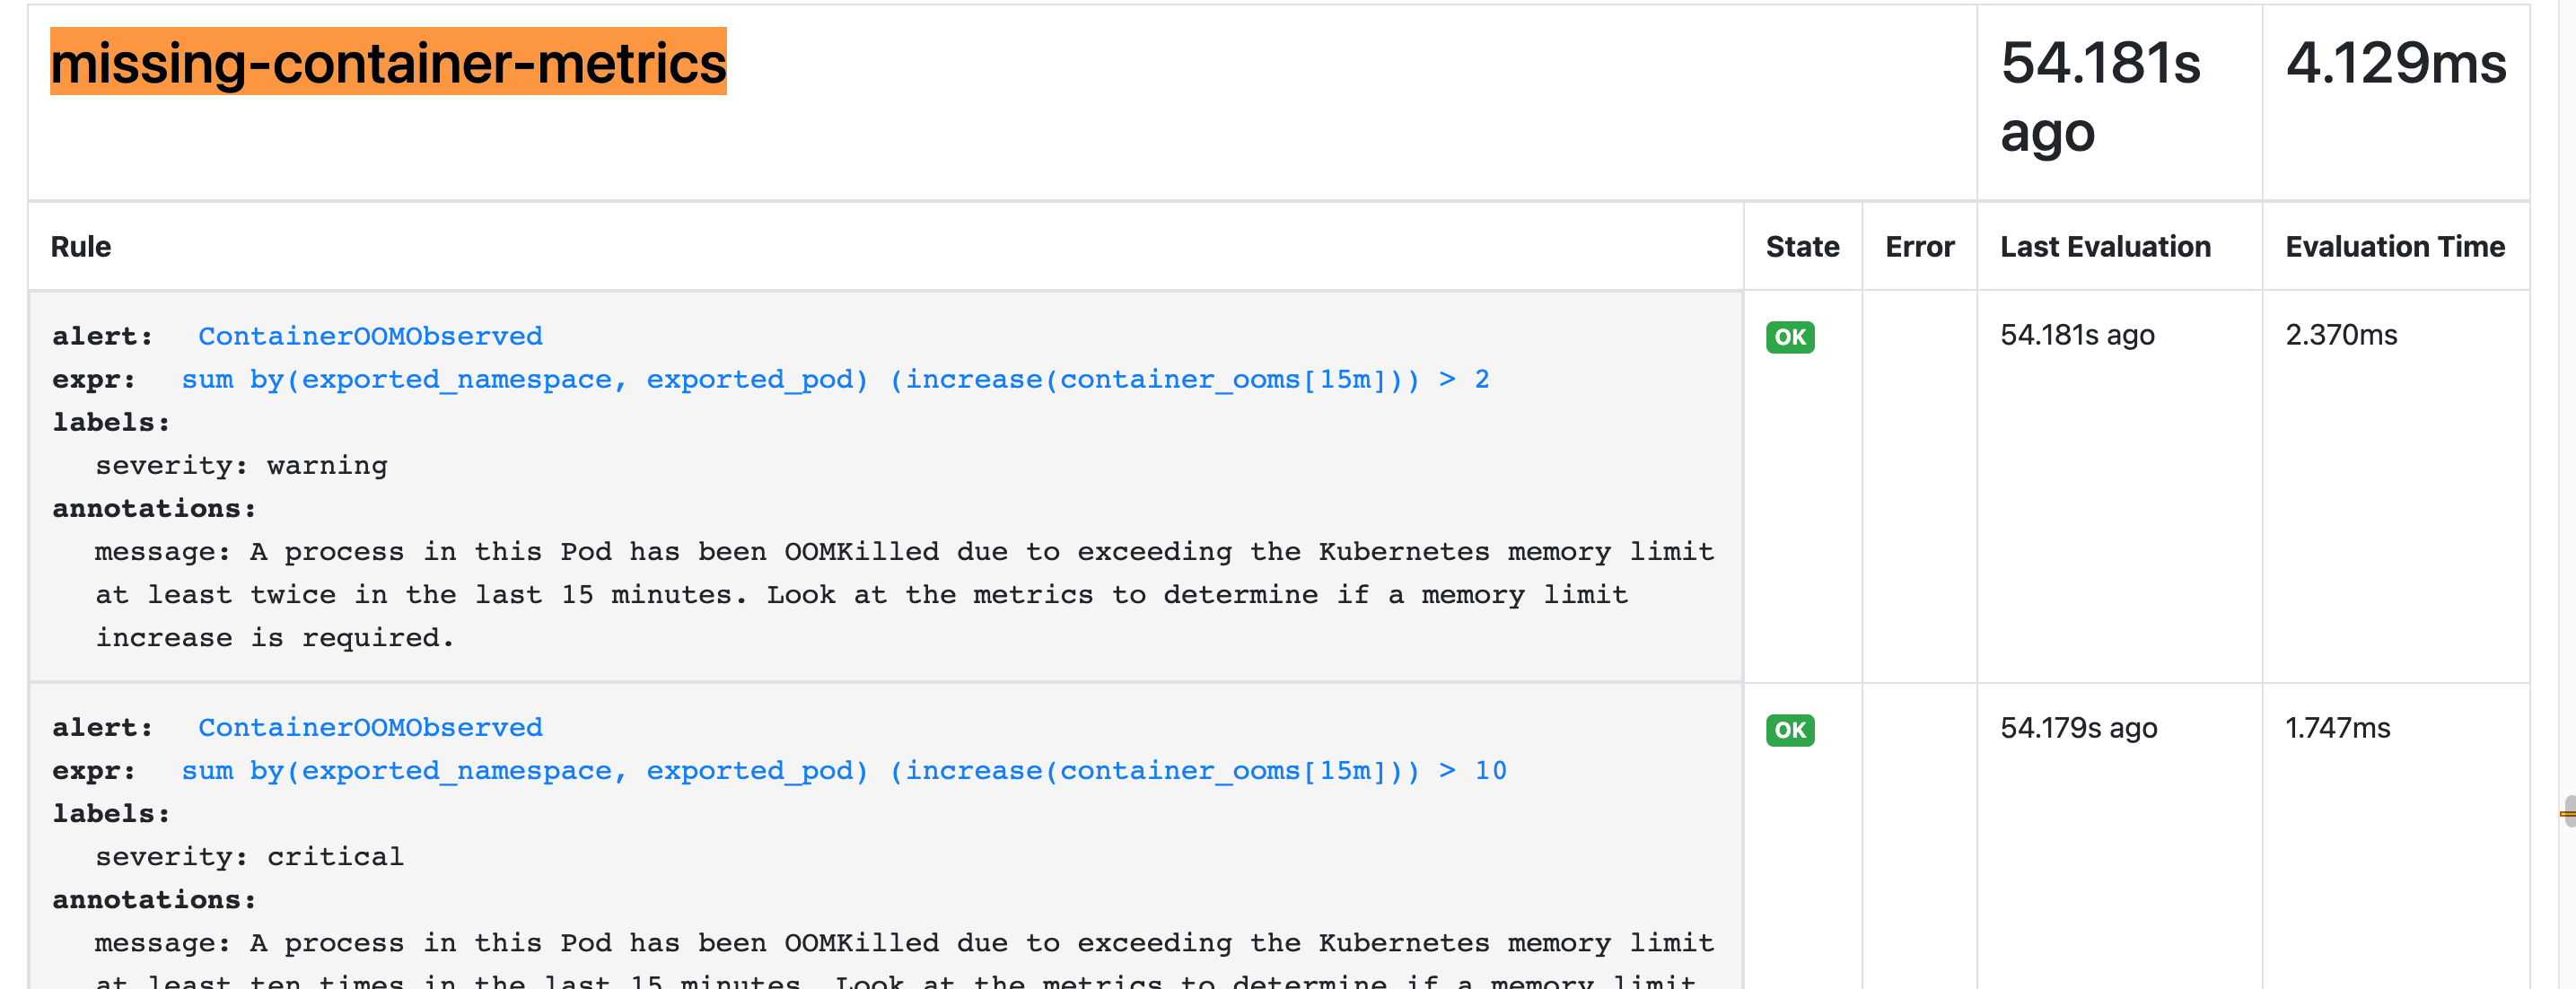
prometheusRule: # Create a Prometheus Operator PrometheusRule resource enabled:true # Namespace defaults to the Release namespace but can be overridden namespace:"" # Additional labels to add to the PrometheusRule so it matches the Operator's ruleSelector selector: prometheus:k8s role:alert-rules # The rules can be set here. An example is defined here but can be overridden. rules: -alert:ContainerOOMObserved annotations: message:AprocessinthisPodhasbeenOOMKilledduetoexceedingtheKubernetesmemorylimitatleasttwiceinthelast15minutes.Lookatthemetricstodetermineifamemorylimitincreaseisrequired. expr:sum(increase(container_ooms[15m]))by(exported_namespace,exported_pod)>2 labels: severity:warning -alert:ContainerOOMObserved annotations: message:AprocessinthisPodhasbeenOOMKilledduetoexceedingtheKubernetesmemorylimitatleasttentimesinthelast15minutes.Lookatthemetricstodetermineifamemorylimitincreaseisrequired. expr:sum(increase(container_ooms[15m]))by(exported_namespace,exported_pod)>10 labels: severity:critical
使用下面命令更新
1
2
3
4
5
6
7
8
[root@master-01addons]# helm upgrade missing-container-metrics -n missing-container-metrics missing-container-metrics/ Release"missing-container-metrics"hasbeenupgraded.HappyHelming! NAME:missing-container-metrics LAST DEPLOYED:TueJul611:36:022021 NAMESPACE:missing-container-metrics STATUS:deployed REVISION:2 TEST SUITE:None
更新后会创建podmonitor和prometeusrules
1
2
3
4
5
6
[root@master-01 addons]# kubectl get prometheusrules.monitoring.coreos.com  -n monitoring
NAME                        AGE
missing-container-metrics   15s
[root@master-01 addons]# kubectl get podmonitors.monitoring.coreos.com  -n missing-container-metrics
NAME                        AGE
missing-container-metrics   35s